
Understanding Key Performance Indicators in PropFuel
Here are a few metrics we recommend you look for to determine success of a campaign:
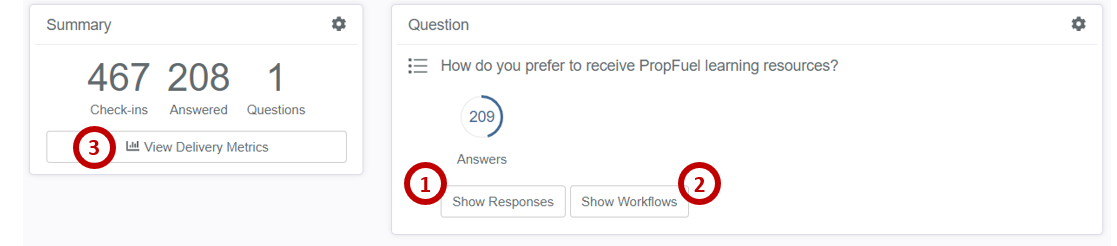
1. Response Rate
The percentage of people responding to a check-in can be viewed in the Insights tab by selecting "View Responses," or in the campaign's History tab by selecting "Show Responses."
Note: by navigating via the Insights page, you'll be limited to the last 30 days of responses by default.
2. Click-throughs
The number of click-throughs to URLs included on landing page or send email actions can be viewed in the campaign's History tab by selecting "Show Workflows."
3. Bounces and Opens
Delivery metrics, along with a full export of all bounced emails can be found by clicking the "View Delivery Metrics" button within the campaign's History tab.
4. Conversion
If your campaign's goal involved people taking action beyond the check-in (signing up for a membership or event, or having them post on your online community, just to name a couple examples!), you may need to compare the list of respondents to those that have taken action recently.
In the case of membership sign-ups or event registration, there are cases where we can track that in PropFuel as a remove workflow or suppression list depending on your connectors. In these cases, you could use the list function to calculate that conversion. It's important to note here: not all people will respond to a check-in before taking your desired action; you may have people that were enrolled in a campaign, were reminded or inspired to take action, but never actually express their intent. Because of that, you may want to build two lists:
1. Those that responded to one or more check-ins and took action.
2. Those that were enrolled in the campaign and took action.
Some list functionality is dependent on which contact fields you have access to via your connector, as well as whether you have event registration accessible via the API to one of your connectors.
For additional information, please email support@propfuel.com.