
Insights Dashboard
The Insights Dashboard is your central hub for understanding member engagement across all your PropFuel campaigns. Track performance metrics, analyze trends, and dig into the details of how your audience interacts with your communications across email, web, and SMS channels.
Filters
At the top of the Insights Dashboard, there are two controls that let you focus the data shown across all widgets and tabs: Period and Filters.
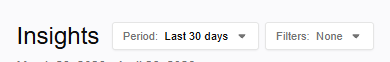
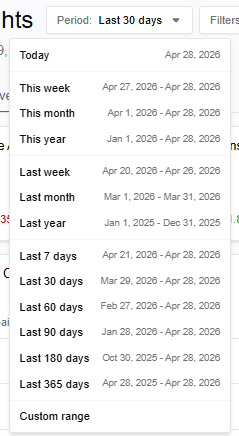
The Period dropdown sets the timeframe for the data. You can choose a preset range, such as Last 90 days, or select Custom range to define your own start and end dates. By default, the page loads the previous 30 days.
The Filters dropdown lets you further narrow the data to a specific subset of your contacts or campaigns, with four options available: Segments, Segment Tags, Campaigns, and Campaign Tags. You can apply one or more of these filters at a time.
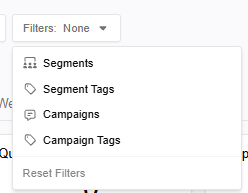
To remove the selected filters, click back into the dropdown and deselect your choices, or click Reset Filters at the bottom of the Filters dropdown to clear all active filters at once.
Trends
Trends are calculated based on the previous period of the same length. For example, if the date range on the Insights page is set to display the previous 60 days, the trend will be based on the 60 days before the selected period. Users can hover over previous period within each widget to get the exact dates being used for calculation:
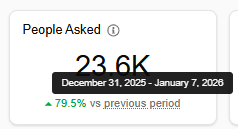
If there is no data for that previous period, the widget will read “No trend available”.
Widgets
Below is a description of each widget on the Insights page, organized by tab.
Overview tab
The Overview tab of the Insights page displays widgets to help break down the activity that happened across all active campaigns for the timeframe selected. It focuses on the questions asked and the responses received.
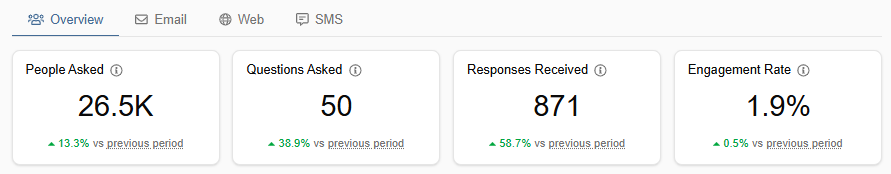
People Asked
The total number of contacts that were asked at least one question across email, web, or SMS within the selected timeframe.
Questions Asked
The total questions asked within the selected timeframe.
Responses Received
The total number of answers received across all campaigns within the selected timeframe. Note: Some responses may be to questions asked outside of the selected timeframe.
Engagement Rate
The rate of how many contacts answered at least 1 question, across all campaigns for the selected timeframe. SMS campaigns are excluded from this metric.
Active Campaign Questions
A detailed view of the questions asked across web and email campaigns within the timeframe selected. By default, the questions are grouped by campaign, but users can choose to group the data by the question asked, which groups based on the question ID. Users can hover over the data in the table for additional information about the question or campaign and easily jump to the question history or the campaign to view more.
The table displays how many contacts were asked and how many answered along with the response rate for the time period. Test responses and data from SMS campaigns and branch questions have been excluded.
Individual Responses
This table displays individual responses that were received within the selected timeframe, sorted by most recent. Users can hover over the data in the table for additional information about the contact, question, or campaign and easily jump to the contact’s profile, the question history or the campaign to view more.
Email tab
The Email tab of the Insights page contains metrics related to email activity for the timeframe selected.
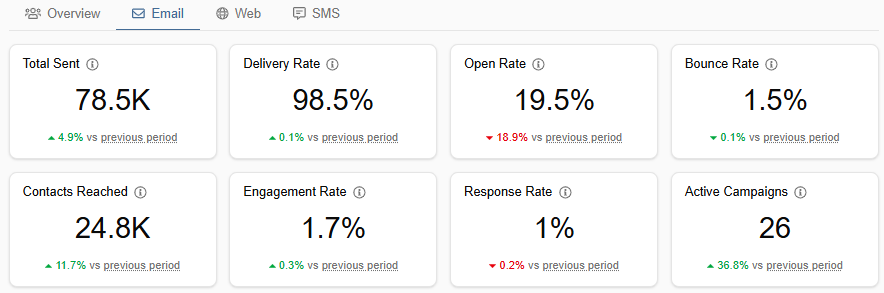
Total Sent
The total emails sent across all email campaigns for the selected timeframe, including all check-ins and reminders.
Delivery Rate
The percentage of emails within the selected timeframe that were successfully delivered to your contacts and did not bounce.
Open Rate
Out of the total number of emails that successfully delivered, the open rate is the percentage of unique contacts that opened an email at least once within the selected timeframe.
Bounce Rate
For the set timeframe, the percentage of emails sent that fail to reach the contact’s inbox. Details of the bounces can be found below in the Bounce Reasons widget.
Contacts Reached
Total number of contacts that have received at least 1 email in the selected timeframe.
Engagement Rate
The percentage of contacts that answered at least 1 question, across all email campaigns for the selected timeframe.
Response Rate
This metric shows the percentage of questions that received an answer across all email campaigns, calculated by comparing the total number of questions asked to the total number of contacts who answered.
Active Campaigns
The number of email campaigns that had at least one email sent during the timeframe selected.
Email Activity
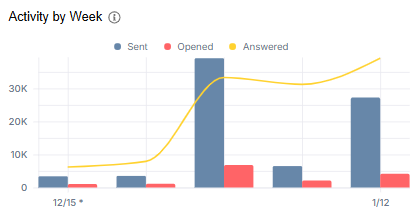
This chart displays the activity around the emails within the selected timeframe. Depending on the length of the timeframe selected, the x-axis may show the data by hour, day, week, or month.
The grouped bar chart displays total emails sent within the timeframe and of those emails sent, how many were opened.
The line graph represents the total responses received from contacts within the selected timeframe. Note: this graph has been scaled for visibility against the bar chart. It accurately displays the response trend within the selected timeframe, but does not correspond with the values of the y-axis.
Users can hover over the graph for the exact values of each.
Busiest Times
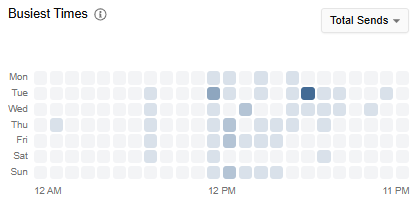
Within the timeframe selected, this widget provides a look at the most popular days and times for the following activities:
Email sends
Email opens
Responses
Unsubscribes by Campaign
The total number of contacts that unsubscribed within the timeframe, along with a breakdown by campaign check-in (the check-in from which the users clicked to unsubscribe). Users can click to View detailed report to view or export a report of the unsubscribes, with the following details:
Campaign ID
Campaign name / Check-in
Contact name
Contact email
Date of unsubscribe
Email Bounces
Total number of emails that were not accepted by the receiving server within the selected timeframe, along with the breakdown by bounce classification. Users can click to View detailed report to view or export a report of individual contacts and their corresponding reason for bouncing.
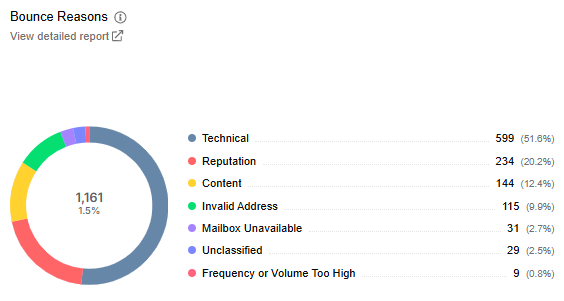
Below is more information about each bounce classification:
Technical: Temporary issues with the recipient's email server (like server downtime or connection problems). These emails might deliver successfully if attempted later.
Invalid Address The email address doesn't exist or is formatted incorrectly. This is a permanent failure and will never be deliverable to that email address.
Reputation: Your sending domain has been flagged by the recipient's email provider for credibility concerns and therefore, your email was rejected.
Content: Something in the email’s message (subject line, links, images, or text) was flagged by the recipient's email provider’s policies.
Mailbox Unavailable: The recipient's mailbox exists but cannot currently receive messages due to full inbox, account suspension, or temporarily disabled.
Frequency or Volume Too High: The recipient's server is rate-limiting or blocking your messages due to volume concerns.
Unclassified: The email provider gave a rejection reason that could not be categorized.
Web tab
The Web tab of the Insights page displays data tracked from your website and any web engagement campaign that is on it.
This tab has filters above the widgets to help narrow the data by device type, visitor type, or specific URL. The filters can be used individually or in conjunction with each other. To clear a filter, click back into its dropdown and select clear, or you can clear all filters by using the Reset Filters button in the top right of the tab.
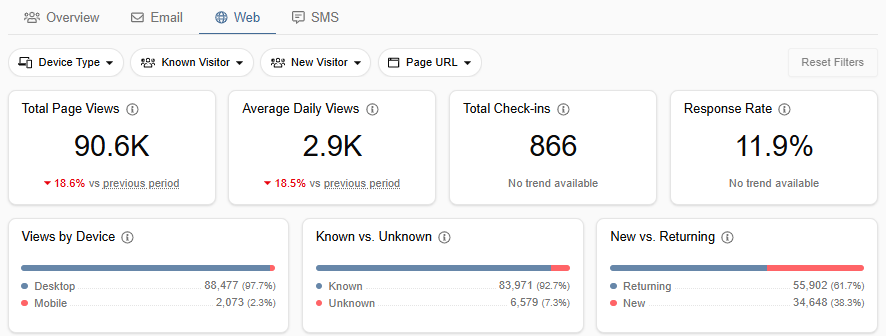
Total Page Views
The total page views by website visitors for the selected timeframe.
Average Daily Views
The average daily page views for the timeframe selected.
Total Check-ins
Total number of check-ins that displayed in the selected timeframe.
Response Rate
Percent of questions answered based on total questions asked against how many contacts answered across all active and archived website campaigns.
Views by Device
Total page views for the selected timeframe segmented by whether the user viewed your website using a desktop or mobile device.
Known vs. Unknown Users
Total page views within the selected timeframe, segmented by known user versus anonymous user. A known user is defined as someone who can be identified by a PropFuel contact record, either from emails to website tracking or authentication through an integration.
New vs. Returning Users
Total page views within the selected timeframe, segmented by new user versus returning user. A returning user is defined as someone who already has the PropFuel cookie from a previous visit to the site.
Page views by Time
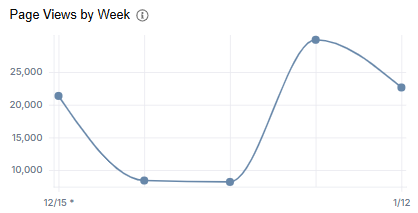
This widget displays the page views trend for the selected timeframe. Depending on the length of the timeframe selected, the x-axis may show the data by hour, day, week, or month.
Busiest Times
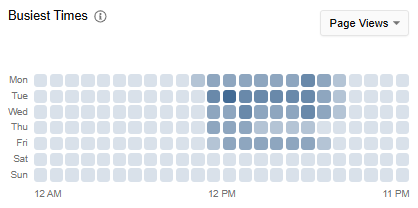
Within the timeframe selected, the Busiest Times widget displays page views by day of the week and time of day to quickly dissect the high-traffic periods for the website(s) with the website plugin embedded.
Using the dropdown in the upper-right corner of the widget, users can choose between all page views or only pages where a web campaign check-in is present.
Top Pages
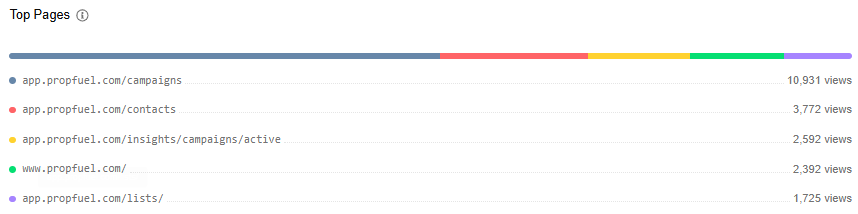
Top 5 URLs based on page views for the timeframe selected. Clicking on a listed URL will open it in a new tab.
SMS tab
The SMS tab of the Insights page contains metrics related to SMS activity for the timeframe selected.
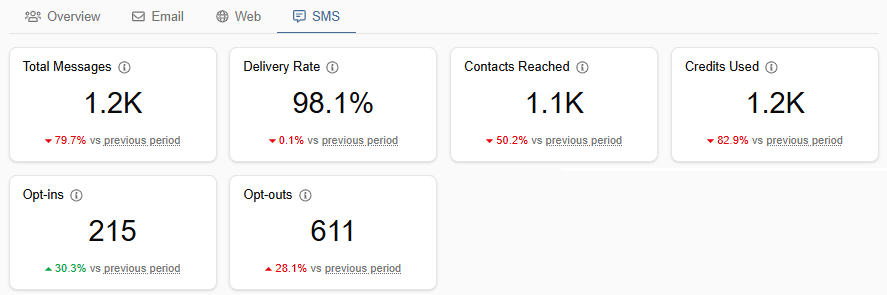
Total Messages
The total number of SMS messages sent across all campaigns within the selected timeframe.
Delivery Rate
The percentage of SMS messages within the selected timeframe that were successfully delivered to your contacts and did not bounce.
Contacts Reached
Total number of contacts that have received at least one SMS in the selected timeframe.
Credits Used
The credits the organization has used within the timeframe.
Opt-ins
Total number of contacts that have opted in to SMS communication within the selected timeframe.
Opt-outs
Total number of contacts that opted out of SMS communication within the selected timeframe.
Opt-ins vs Opt-outs
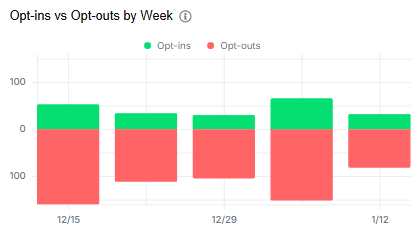
A diverging bar chart comparing opt-ins and opt-outs for the selected timeframe. Bars above the neutral line represent opt-ins; bars below represent opt-outs. Depending on the length of the timeframe selected, the x-axis may show the data by hour, day, week, or month.
SMS Bounces
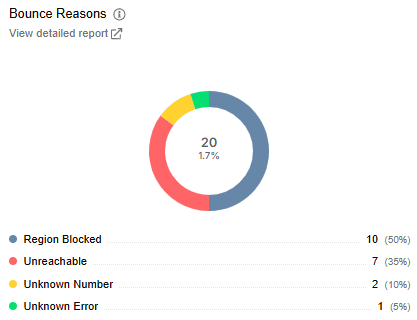
Total SMS bounces for the selected timeframe along with the breakdown by classification. Users can click to View detailed report to view or export a report to see the individual contacts and their corresponding reason for bouncing.
Unreachable: The phone number was unable to receive messages due to temporary issues like the device being turned off, out of service range, or having network connectivity problems.
Unknown Number: The phone number doesn't exist, is invalid, or isn't recognized by the carrier. This is typically a permanent delivery failure.
Region Blocked: SMS delivery to this geographic region or country is blocked, either due to regulatory restrictions, carrier limitations, or other account settings.
Landline/Unreachable: The number belongs to a landline phone and therefore cannot receive SMS messages or is otherwise unable to receive text messages due to the phone type or plan limitations.
Unknown: The carrier provided an error for the delivery failure that could not be categorized.
SMS Campaigns
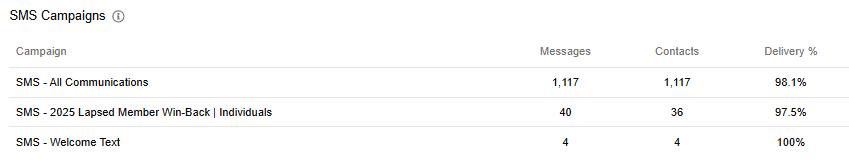
The table in this widget displays SMS campaigns with sends during the selected timeframe and the total messages sent, total contacts reached, and delivery rate for each. Users can hover over the data in the table for additional information about the campaign and easily jump to the campaign to view more.