
Website Engagement Analytics
PropFuel’s Website Engagement Analytics dashboard offers a powerful way to understand how your audience interacts with your website. While it’s not intended to replace full-service analytics tools like Google Analytics, it provides actionable insights for optimizing engagement through PropFuel campaigns.
This dashboard helps you:
Monitor how many people visit your site
Identify which pages attract the most traffic
Understand where visitors are engaging (or not engaging)
Launch and tailor campaigns based on actual website behavior
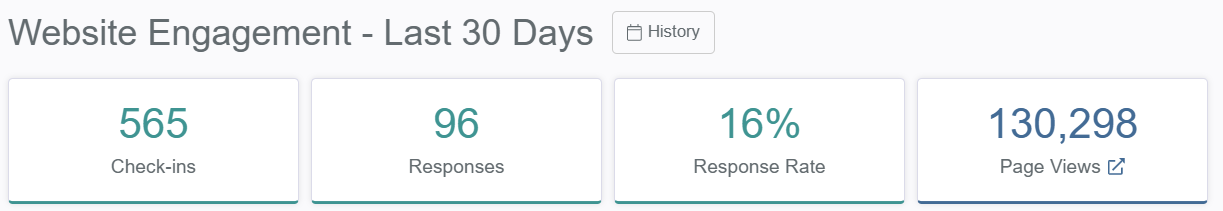
Overview Metrics (Last 30, 60, or 90 Days)
At the top of your Website Engagement campaigns list, you’ll see key metrics:
Check-ins: The total number of page views where a PropFuel website engagement question was shown.
Responses: The number of answers submitted through website engagement campaigns.
A lower response count may suggest visitors are seeing the check-in but not interacting. You might consider testing different questions, formats, or page placements.
Response Rate: The percentage of check-ins that received a response.
Page Views: The total number of times your webpages were viewed within the selected date range, across all domains where the PropFuel plugin is installed.
Note: Check-ins and response counts may include duplicates if visitors clear cookies and revisit the page. Response Rate is generally the more reliable engagement metric.
Navigating the Website Analytics Dashboard
To access the Website Analytics dashboard, click the pop-out button next to “Page Views” at the top of your campaign list. This will take you to a centralized view where you can explore metrics across all web properties where the PropFuel tracking code is installed.
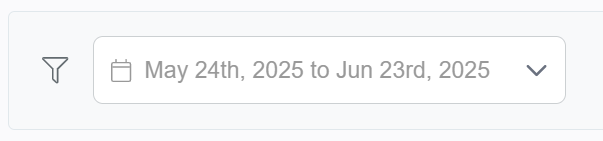
Date Range Filter
Use the filter at the top to adjust the time window. You can choose between one of the pre-set filters or select a custom date range.
Total Page Views
The total number of times your webpages were viewed within the selected date range, across all domains where the PropFuel plugin is installed.
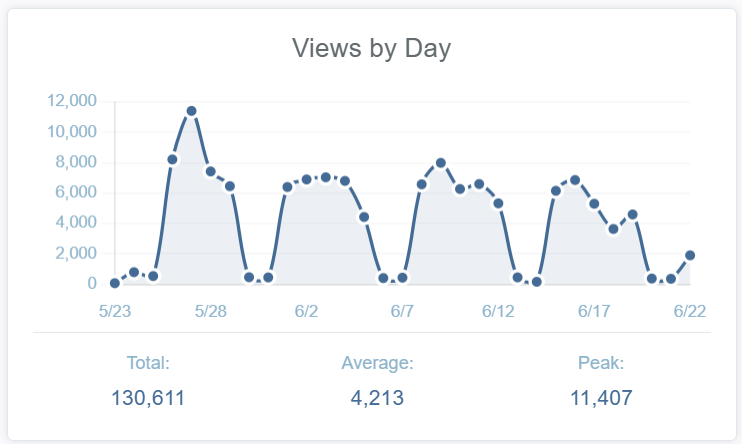
Views by Day
This chart shows traffic trends and fluctuations. You’ll see:
Total: The total number of page views recorded during the selected date range.
Average: The average number of page views per day, calculated by dividing the total by the number of days in your selected range.
Peak: The highest number of page views recorded on a single day within your selected date range.
Use this section to identify high-traffic periods where engagement opportunities may be missed or where campaign performance may be optimized.
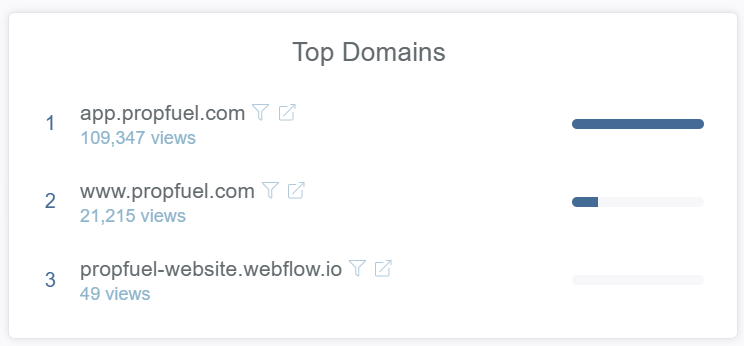
Top Domains
See which domains are generating the most page views. These are the websites where the PropFuel plugin is installed (e.g., your main site, LMS, member portal, etc.).
To maximize insights and engagement opportunities, we recommend installing the PropFuel tracking code on all domains you manage. This way you can:
Increase visibility into visitor behavior
Enable campaigns to run on multiple platforms (e.g., public site, LMS, member portal)
Uncover more touchpoints where engagement is possible
Top Pages
Understand which specific pages are most visited. This helps you identify where to place check-ins for maximum visibility and relevance.
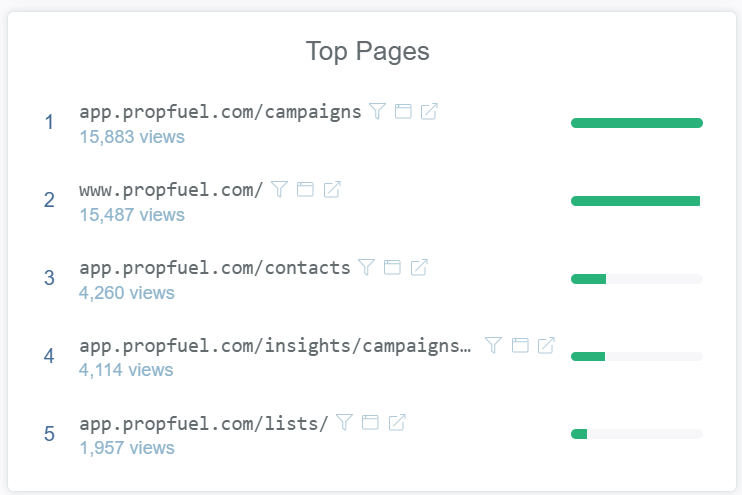
Use Cases:
High-Traffic Pages: Great candidates for awareness and contact collection campaigns.
Content Hubs: Add campaigns to resources, blog posts, or help articles to collect feedback or spark deeper interaction.
Membership Pages: Ask visitors if they need help joining or renewing.
You can immediately start building a campaign that targets visitors on specific pages by clicking the little browser icon next to the page address:

PropFuel will automatically fill in the targeting condition based on the selected page URL.
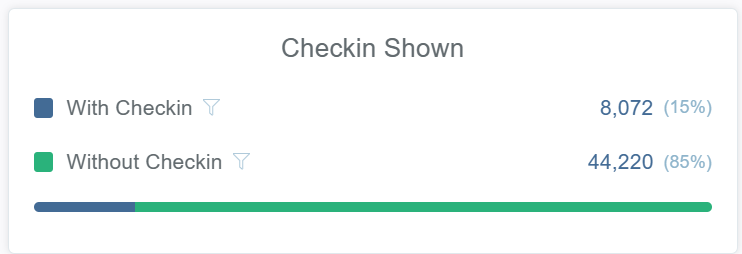
Check-ins Shown
This chart breaks down your total page views into:
With Check-in: Page views where a PropFuel question was shown
Without Check-in: Page views that did not include any question
This helps identify:
Missed engagement opportunities
Underutilized high-traffic areas
Some clients see 10–20% of their total page views include a check-in once campaigns are fully built out across their site.
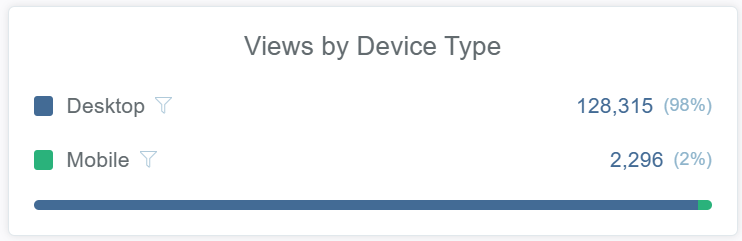
Views by Device Type
This section shows how visitors access your site, either by desktop or mobile.
Desktop: Typically, the majority of traffic, especially for event sites or member portals.
Mobile: Useful to track, but PropFuel website engagement campaigns are currently not supported on mobile devices.
While mobile traffic is shown for reference, engagement campaigns will only be displayed to desktop users. This insight helps you focus your campaign efforts where interaction is currently possible and ensures an optimal user experience.
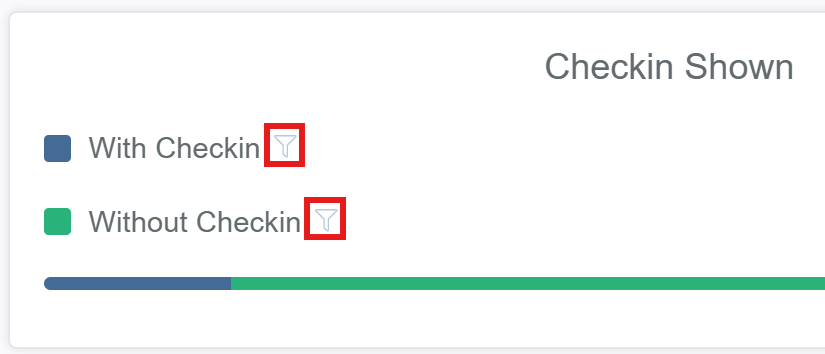
Filter by Domain, Page, Check-in Shown, or Device Type
Throughout the dashboard, you’ll notice small filter icons next to many metrics. Clicking these allows you to filter the dashboard data based on that specific value.
Filters can be stacked to refine your view. For example, you could narrow the data to only show page views of your homepage, from your main domain, accessed via desktop, where a check-in was shown. You can also apply each filter individually, depending on what you’re looking to analyze.
If you have questions about how to interpret your analytics or want help building a high-converting campaign, reach out to our support team. We’re here to help!
Viewing Campaign-Level Data
Within each website engagement campaign, you can access two tabs for deeper insights:
History Tab
View detailed performance data for your campaign, including:
How many check-ins were shown
Engagement rate
Breakdown of responses by question
This is where you'll see exactly how visitors are interacting with your questions and which answers they're selecting.
Membership AI Tab
The Membership AI tab helps you discover which visitor behaviors are worth tracking based on your campaign's goal.
Campaign Context
Membership AI automatically generates a description and goal for your campaign based on how it's set up. You can edit both fields to improve accuracy. The richer this context is, the better the AI's Signal recommendations will be.
Example:
Description: "Assist visitors in locating desired content by prompting them for what they're looking for."
Goal: "Help visitors quickly locate the information or resources they need, reducing navigation friction and bounce rates while boosting overall site engagement and conversion."
Tracked Signals
View all Signals currently active for this campaign. Click any Signal name to see match counts, trends, and related segments.
AI Suggested Signals to Track
Based on your campaign's goal and questions, Membership AI recommends behaviors worth tracking. Each suggestion shows:
Priority level: How closely the Signal aligns with your campaign goal (High, Medium, Low)
Type: The behavior being detected (Option Selection, Unanswered Check-in, Rating Selection, etc.)
Threshold: The specific criteria that trigger a match
Example Signal:
High interest in professional development course
Based on: Check-in #1 - "What can we help you find?"
These contacts are signaling a clear interest in a specific educational offering, indicating they may be ready to enroll or need more information to move forward.
Click Start Tracking to activate a Signal. You can customize its name, description, and criteria before finalizing.