
Understanding Campaign Metrics and History
This article provides an overview of the campaign history dashboard in PropFuel, covering key metrics and tools available to help you analyze and understand your campaign performance.
Dashboard Summary
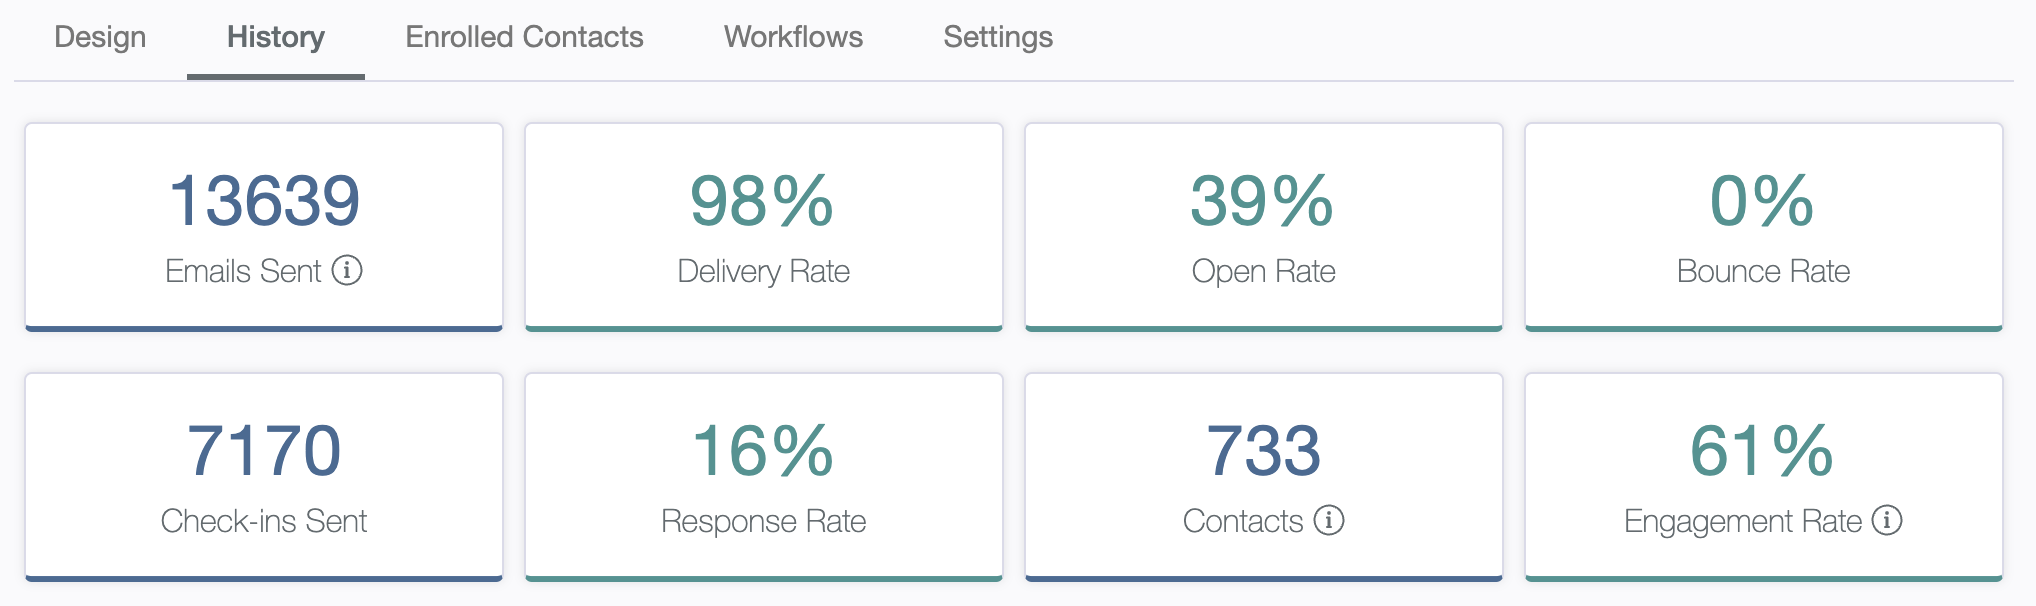
At the top of the campaign history page, there’s a dashboard with high-level statistics for the entire campaign. Here’s a breakdown of the information displayed:
Total Contacts in Campaign: Shows the number of contacts enrolled in the campaign.
Total Check-ins Sent: Refers to the initial emails sent as part of the campaign.
Total Email Count: Includes both the initial prompt email and any reminder emails. Hovering over the help icon provides a further explanation.
Delivery Rate: Percentage of emails successfully delivered to contacts.
Open Rate: Percentage of delivered emails opened by contacts.
Bounce Rate: Percentage of emails that failed to reach contacts.
Response Rate: Average response rate across all check-ins in the campaign.
Engagement Rate: Percentage of contacts who answered at least one question in the campaign.
Check-in Level Details
For each check-in within the campaign, more specific data is available:
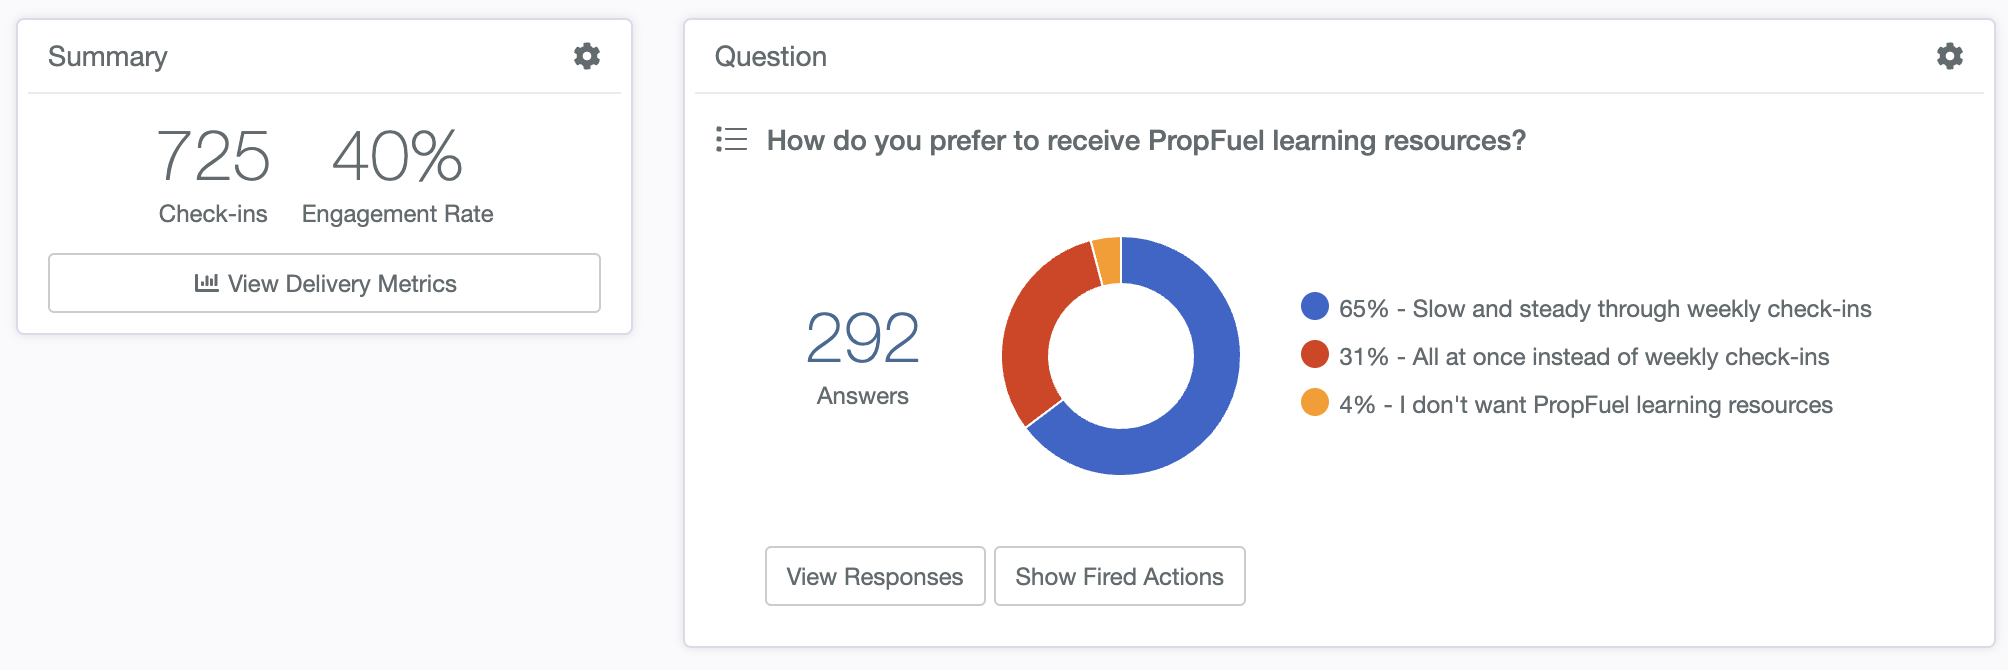
Summary Box (Left Side):
Check-ins Sent: The total number of check-ins sent for this specific question.
Engagement Rate: The rate at which contacts engaged with this particular check-in.
Response Rate: The percentage of contacts who provided a response.
View Delivery Metrics: By clicking this button, you can see detailed delivery metrics for the initial send (prompt) and any reminders. It includes data on bounces and allows export of bounce data with reasons.
Question Box (Right Side):
Question: Displays the question, the number of responses, and a chart visualizing the responses (pie charts, bar graphs, etc., depending on the question type).
View Responses: Allows you to see each individual response, add filters, and export responses.
Show Fired Actions: Displays all actions associated with specific responses (e.g., clicks on options that trigger an email, redirect to a URL, display text on a landing page, etc.).
Export Options
You can export your data for offline analysis in two formats:
PDF Export: Provides a formatted report for review and sharing.
CSV Export: Offers a spreadsheet-compatible file for deeper data manipulation.
This campaign history feature gives you a comprehensive view of how your campaign is performing, with tools to analyze engagement, response rates, and specific responses, enabling you to gain valuable insights into your members' interactions.